

Weekly Charts – Week of July 13th

Cover image illustrations of charts for the Week of July 13
This week, we look at semiconductors, the bonds of hyperscalers, the U.S. national debts and AI models. The Information presented does not involve the rendering of personalized investment advice but is limited to the dissemination of general information. This information should not be construed as an offer to buy or sell, or a solicitation of any offer to buy or sell the securities that might be mentioned herein.

On a weekly basis I share 4 charts/tables that I find interesting. I hope you find them educational. Please feel free to share or respond if you want to dig deeper on a particular topic. As always, nothing here is a recommendation.
Share the Post:

Related Posts

Cover slide for Weekly Charts of June 8th

Weekly Charts – Week of June 8th

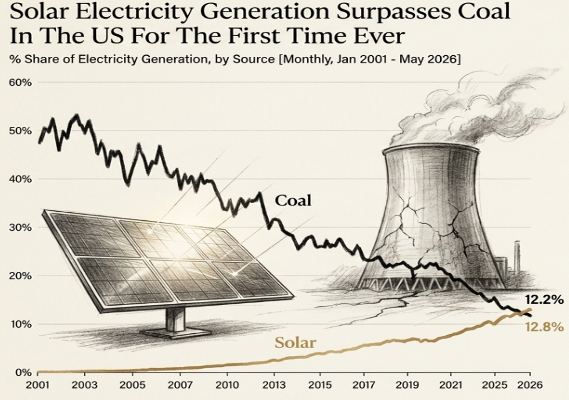
This week, we look at solar electricity, the broadening stock market, the latest inflation numbers and what the Fed might do at their next meeting.

The Information presented does not involve the rendering of personalized investment advice but is limited to the dissemination of general information. This information should not be construed as an offer to buy or sell, or a solicitation of any offer to buy or sell the securities that might be mentioned herein.
Read More
Cover slide for Weekly Charts - Week of June 15th

Weekly Charts – Week of June 15th

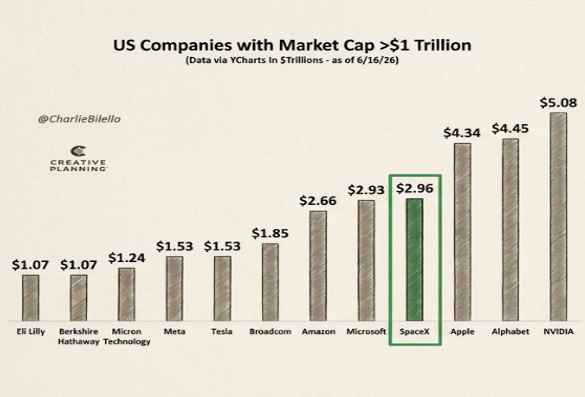
This week, we look at companies with a market cap above $1 Trillion, the IPO market, the Warsh Fed and how the stock market likes to test new Fed Chairs.

The Information presented does not involve the rendering of personalized investment advice but is limited to the dissemination of general information. This information should not be construed as an offer to buy or sell, or a solicitation of any offer to buy or sell the securities that might be mentioned herein.

Read More