On a weekly basis I share 4 charts/tables that I find interesting. I hope you find them educational. Please feel free to share or respond if you want to dig deeper on a particular topic. As always, nothing here is a recommendation.
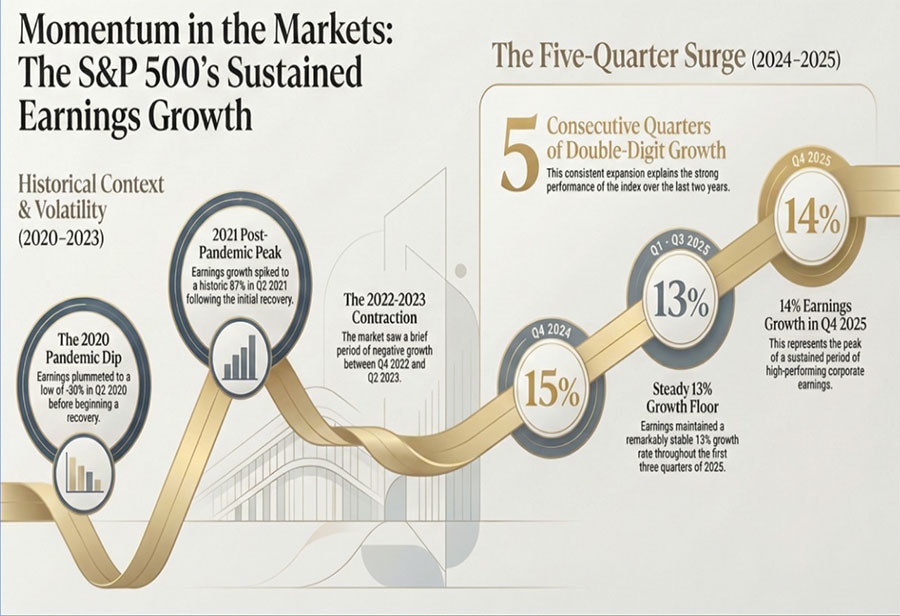
Despite recent geopolitical headwinds, the S&P 500 has demonstrated remarkable resilience, officially recording five consecutive quarters of double-digit earnings growth as of Q4 2025. This streak, which began in late 2024, marks the most consistent period of expansion since 2018. While the “Magnificent 7” continue to lead with growth rates above 20%, we are seeing a critical broadening of the market, with the remaining “S&P 493” posting a healthy 9.8% improvement.
Current data suggests we are at a significant inflection point. As Manufacturing PMI recovers, capital is beginning to rotate out of crowded institutional favorites and into underappreciated cyclical sectors. This shift toward “market breadth” is historically significant; as of early 2026, over two-thirds of the stocks in the index are outperforming the S&P 500 itself—the highest level of participation seen in roughly five decades.
Key Takeaways:
- Five-Quarter Earnings Surge: The S&P 500 recorded a blended growth rate of 14.2% in Q4 2025, significantly exceeding early analyst estimates of 8.3%.
- Manufacturing Recovery: Manufacturing PMI has recorded two consecutive readings above 50, signaling expansion and a likely shift in leadership toward cyclical industries like housing and transportation.
- Historic Market Breadth: Market participation has more than doubled since 2025, with 66.4% of stocks now outperforming the broader index, signaling a healthier and more durable phase of expansion.
- AI Capex & ROI Anxiety: Investors are increasingly weighing massive AI capital expenditures against actual returns, contributing to the rotation away from mega-cap “momentum” names.
- Geopolitical Resilience: While recent regional strikes have increased short-term volatility, historical data shows the S&P 500 typically recovers within 3 to 12 months following major geopolitical shocks.