On a weekly basis I share 4 charts/tables that I find interesting. I hope you find them educational. Please feel free to share or respond if you want to dig deeper on a particular topic. As always, nothing here is a recommendation.
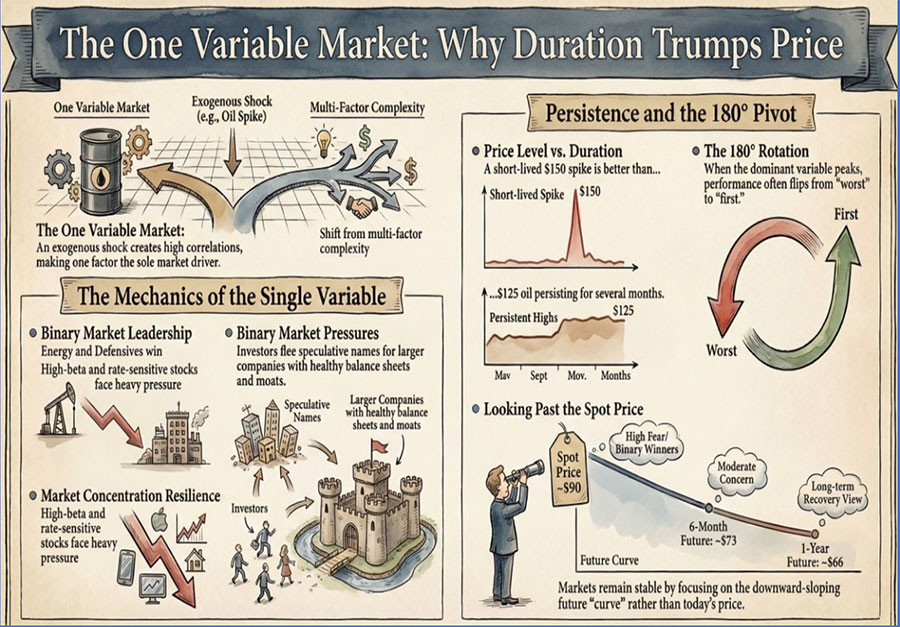
Managing risk in the current environment is uniquely challenging because traditional frameworks—like valuation, sentiment, and economic fundamentals—have taken a backseat to a single dominant variable: the price of oil. In this “One Variable Market,” an exogenous shock creates high correlations, making energy the primary driver of both risk and leadership.
However, the headline “spot price” tells only half the story. As we explore in this week’s charts, the duration of elevated prices matters far more than a brief peak. While a short-lived spike is manageable, sustained high prices begin to embed themselves into consumer behavior and broader economic data.
In this post, we break down:
The Single Variable Mechanics: Why high-beta and rate-sensitive stocks are facing heavy pressure while large, “moated” companies remain the safe haven.
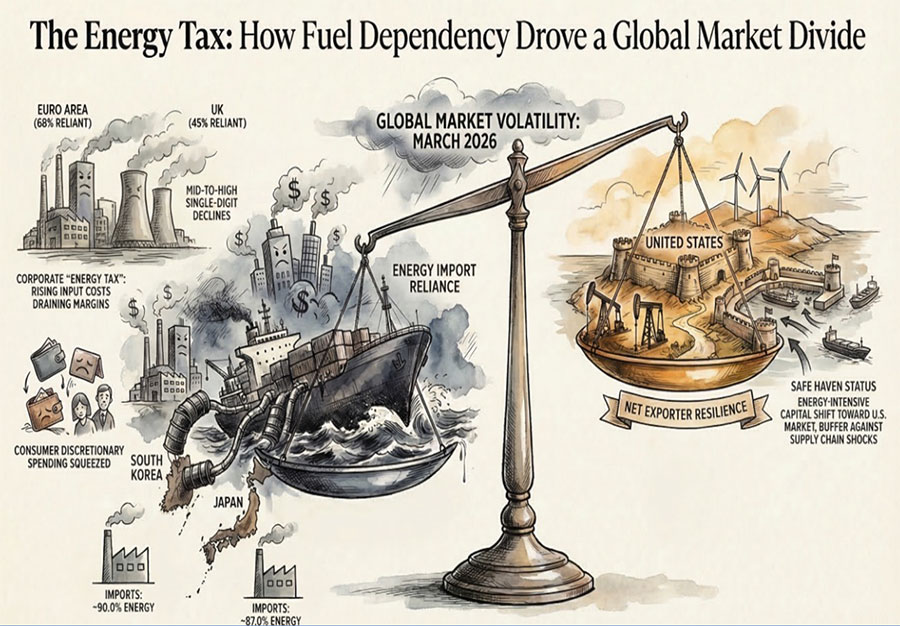
The Resilient U.S. Economy: How the U.S. has “leaned out” its energy intensity by 60% since 1960, making our economy far more stable than energy-dependent markets in Asia and Europe.
The Jobless Recovery: Analysis of the “Great Disconnect,” where corporate profits are booming at 9.3% YoY, yet payroll growth has stalled at a mere 0.2%.
Understanding these macro shifts is key to avoiding an over-correction in your portfolio. Even as we navigate this energy-driven volatility, underlying economic momentum remains visible, suggesting that a 180° rotation could be on the horizon once the dominant variable peaks.
Key Takeaways:
- Energy Intensity: The U.S. now generates significantly more economic output for every British Thermal Unit (Btu) consumed compared to 1980.
Global Chokepoints: Asia claims ~90% of the crude oil and 84% of the LNG transiting the Strait of Hormuz, making foreign indices much more vulnerable to Middle East disruptions than the U.S..
The Employment Gap: Real investment in equipment is up 9.4% YoY—a pace that typically supports 2.5% job growth—yet actual hiring is failing to keep pace