
Energy Security and the New Geopolitical Playbook

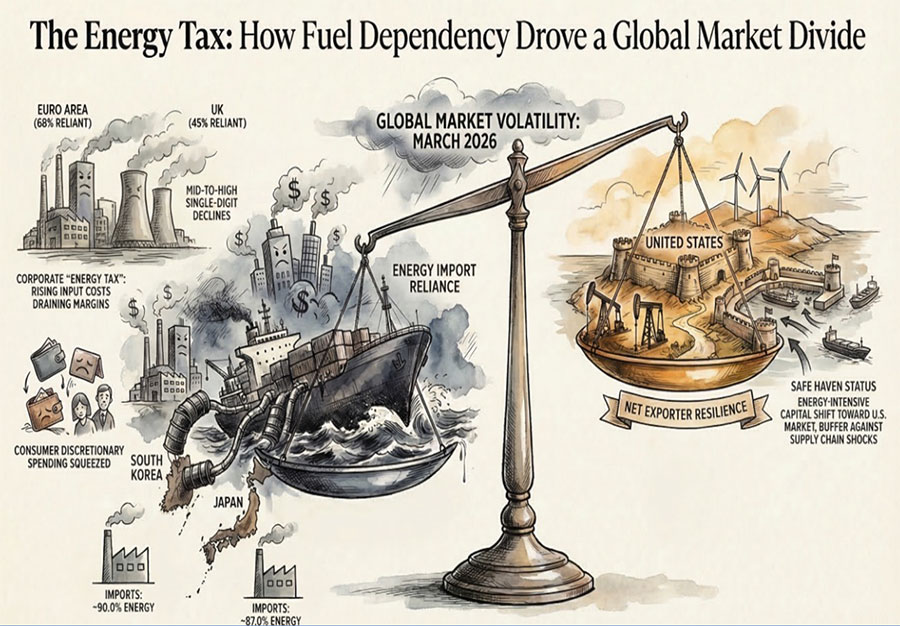
The recent surge in global energy prices has provided a masterclass in financial resilience. While headlines often focus on the conflict itself, the real story for investors is the stark divergence in how different economies and asset classes are responding.

On a weekly basis I share 4 charts/tables that I find interesting. I hope you find them educational. Please feel free to share or respond if you want to dig deeper on a particular topic. As always, nothing here is a recommendation.

The recent surge in global energy prices has provided a masterclass in financial resilience. While headlines often focus on the conflict itself, the real story for investors is the stark divergence in how different economies and asset classes are responding. From the “energy tax” impacting import-dependent nations to the surprising shift in traditional “safe haven” assets, the market is currently defying historical patterns. In this week’s charts, we break down why the U.S. remains a relative anchor of stability and what the $100-per-barrel oil threshold means for inflation and your borrowing costs.


Key Takeaways:

  • The Energy Divide: Japan and South Korea saw double-digit or near-double-digit equity plunges due to energy import reliance, while the S&P 500 remained resilient with only a 3.0% decline.

  • The Stagflation Threat: Rising oil prices increase the probability of “Quad 3″—a regime of decelerating growth paired with accelerating inflation.

  • The Debt Factor: With national debt approaching $40 trillion and war-related spending rising, the Treasury is forced to offer higher yields to attract buyers, keeping borrowing costs elevated for everyone.
Share the Post:

Related Posts

Cover slide for Weekly Charts of June 8th

Weekly Charts – Week of June 8th

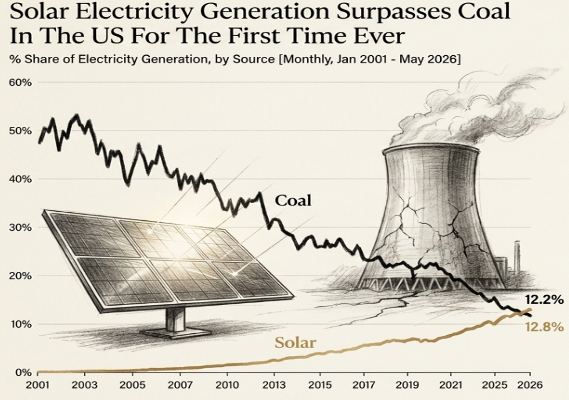
This week, we look at solar electricity, the broadening stock market, the latest inflation numbers and what the Fed might do at their next meeting.

The Information presented does not involve the rendering of personalized investment advice but is limited to the dissemination of general information. This information should not be construed as an offer to buy or sell, or a solicitation of any offer to buy or sell the securities that might be mentioned herein.

Read More
Cover slide for Weekly Charts - Week of June 15th

Weekly Charts – Week of June 15th

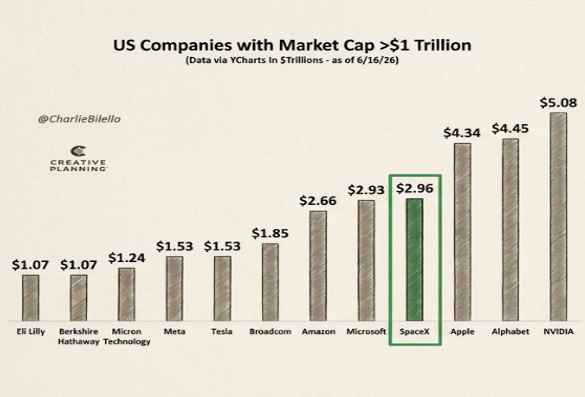
This week, we look at companies with a market cap above $1 Trillion, the IPO market, the Warsh Fed and how the stock market likes to test new Fed Chairs.

The Information presented does not involve the rendering of personalized investment advice but is limited to the dissemination of general information. This information should not be construed as an offer to buy or sell, or a solicitation of any offer to buy or sell the securities that might be mentioned herein.

Read More